Random Chapter
Click random to get a fresh chapter.
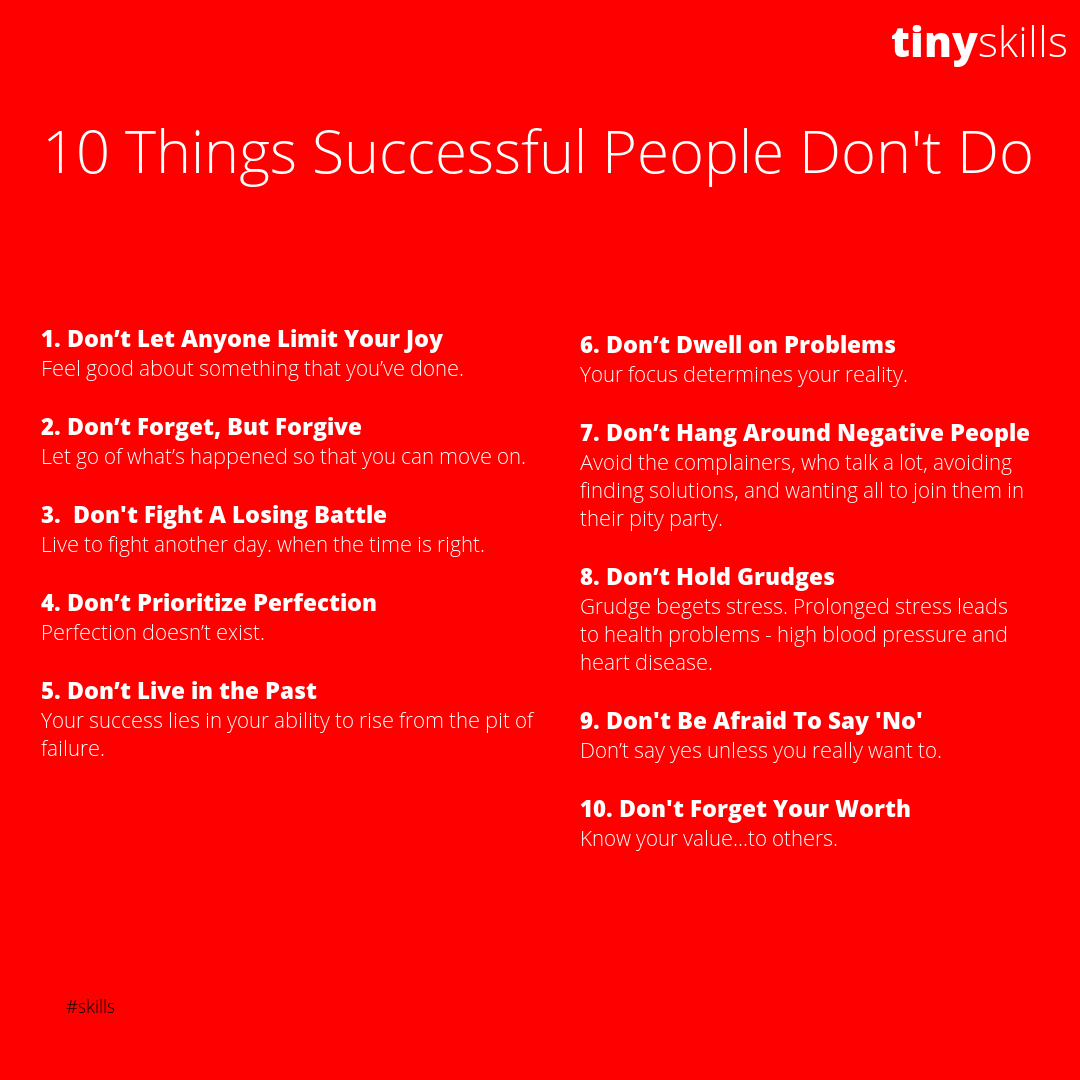
10 Things Successful People Don't Do

1. Don’t Let Anyone Limit Your Joy
Feel good about something that you’ve done. Don’t let anyone’s opinions or accomplishments take that away from them. You don’t have to compare yourself to others .Take people’s opinions with a grain of salt.
Remember: You’re never as good or bad as they say you are.
2. Don’t Forget, But Forgive
Let go of what’s happened so that you can move on. But do not give a wrongdoer another chance.
3. Don't Fight A Losing Battle
Live to fight another day. Take a god's eye view of things. This way, you’re able to choose your battles wisely and only stand your ground when the time is right.
4. Don’t Prioritize Perfection
Perfection doesn’t exist. We are humans. We come up short in some way.Stop wasting your time on thinking about your failures. Instead, enjoy what you were able to achieve.
5. Don’t Live in the Past
Your success lies in your ability to rise from the pit of failure. You can’t do this when you’re living in the past.
When you live in the past, you stop you from believing in your ability to succeed. Thus, your past becomes your present, preventing you from moving forward.
6. Don’t Dwell on Problems
Your focus determines your reality. A mind busy with problems prolongs negative emotions and stress, which hinders your performance.
Instead, focus on actions that improve yourself and your circumstances. Positive, solution-focused work begets positive emotions.
7. Don’t Hang Around Negative People
Avoid the complainers, who talk a lot, avoiding finding solutions, and wanting all to join them in their pity party. You may think you have to listen but there’s a thin line between sympathetic listening and getting sucked into the complainer's negative emotional spiral.
Set limits. Distance yourself when necessary. Ask the complainers if they have any solution to the problem. This will either shut them up or make them think productive things.
8. Don’t Hold Grudges
Grudge begets stress. Prolonged stress leads to health problems - high blood pressure and heart disease, for example. Think positive, productive things.
9. Don't Be Afraid To Say 'No'
Don’t say yes unless you really want to. At work, saying yes all the time increases stress, often leading to stress, burnout, and even depression.
Say 'No' smartly. Bring their attention to your existing commitments, for starters.
10. Don't Forget Your Worth
Know your value...to others. In professional life, you need to show how you can be useful to them.
Business professionals need to answer the WIFM questions of cusstomersc and clients - What's in it for me?
If you liked this, you may like Tiny Skills - 250+ Top Work & Personal Skills Made Easy.